-
Features
Stock Analysis
Stock Screener
Filter by price performance, growth, fundamentals, valuation, dividends & technicals
Mutual Funds and ETFs
Compare by expense ratios, sectors, performance
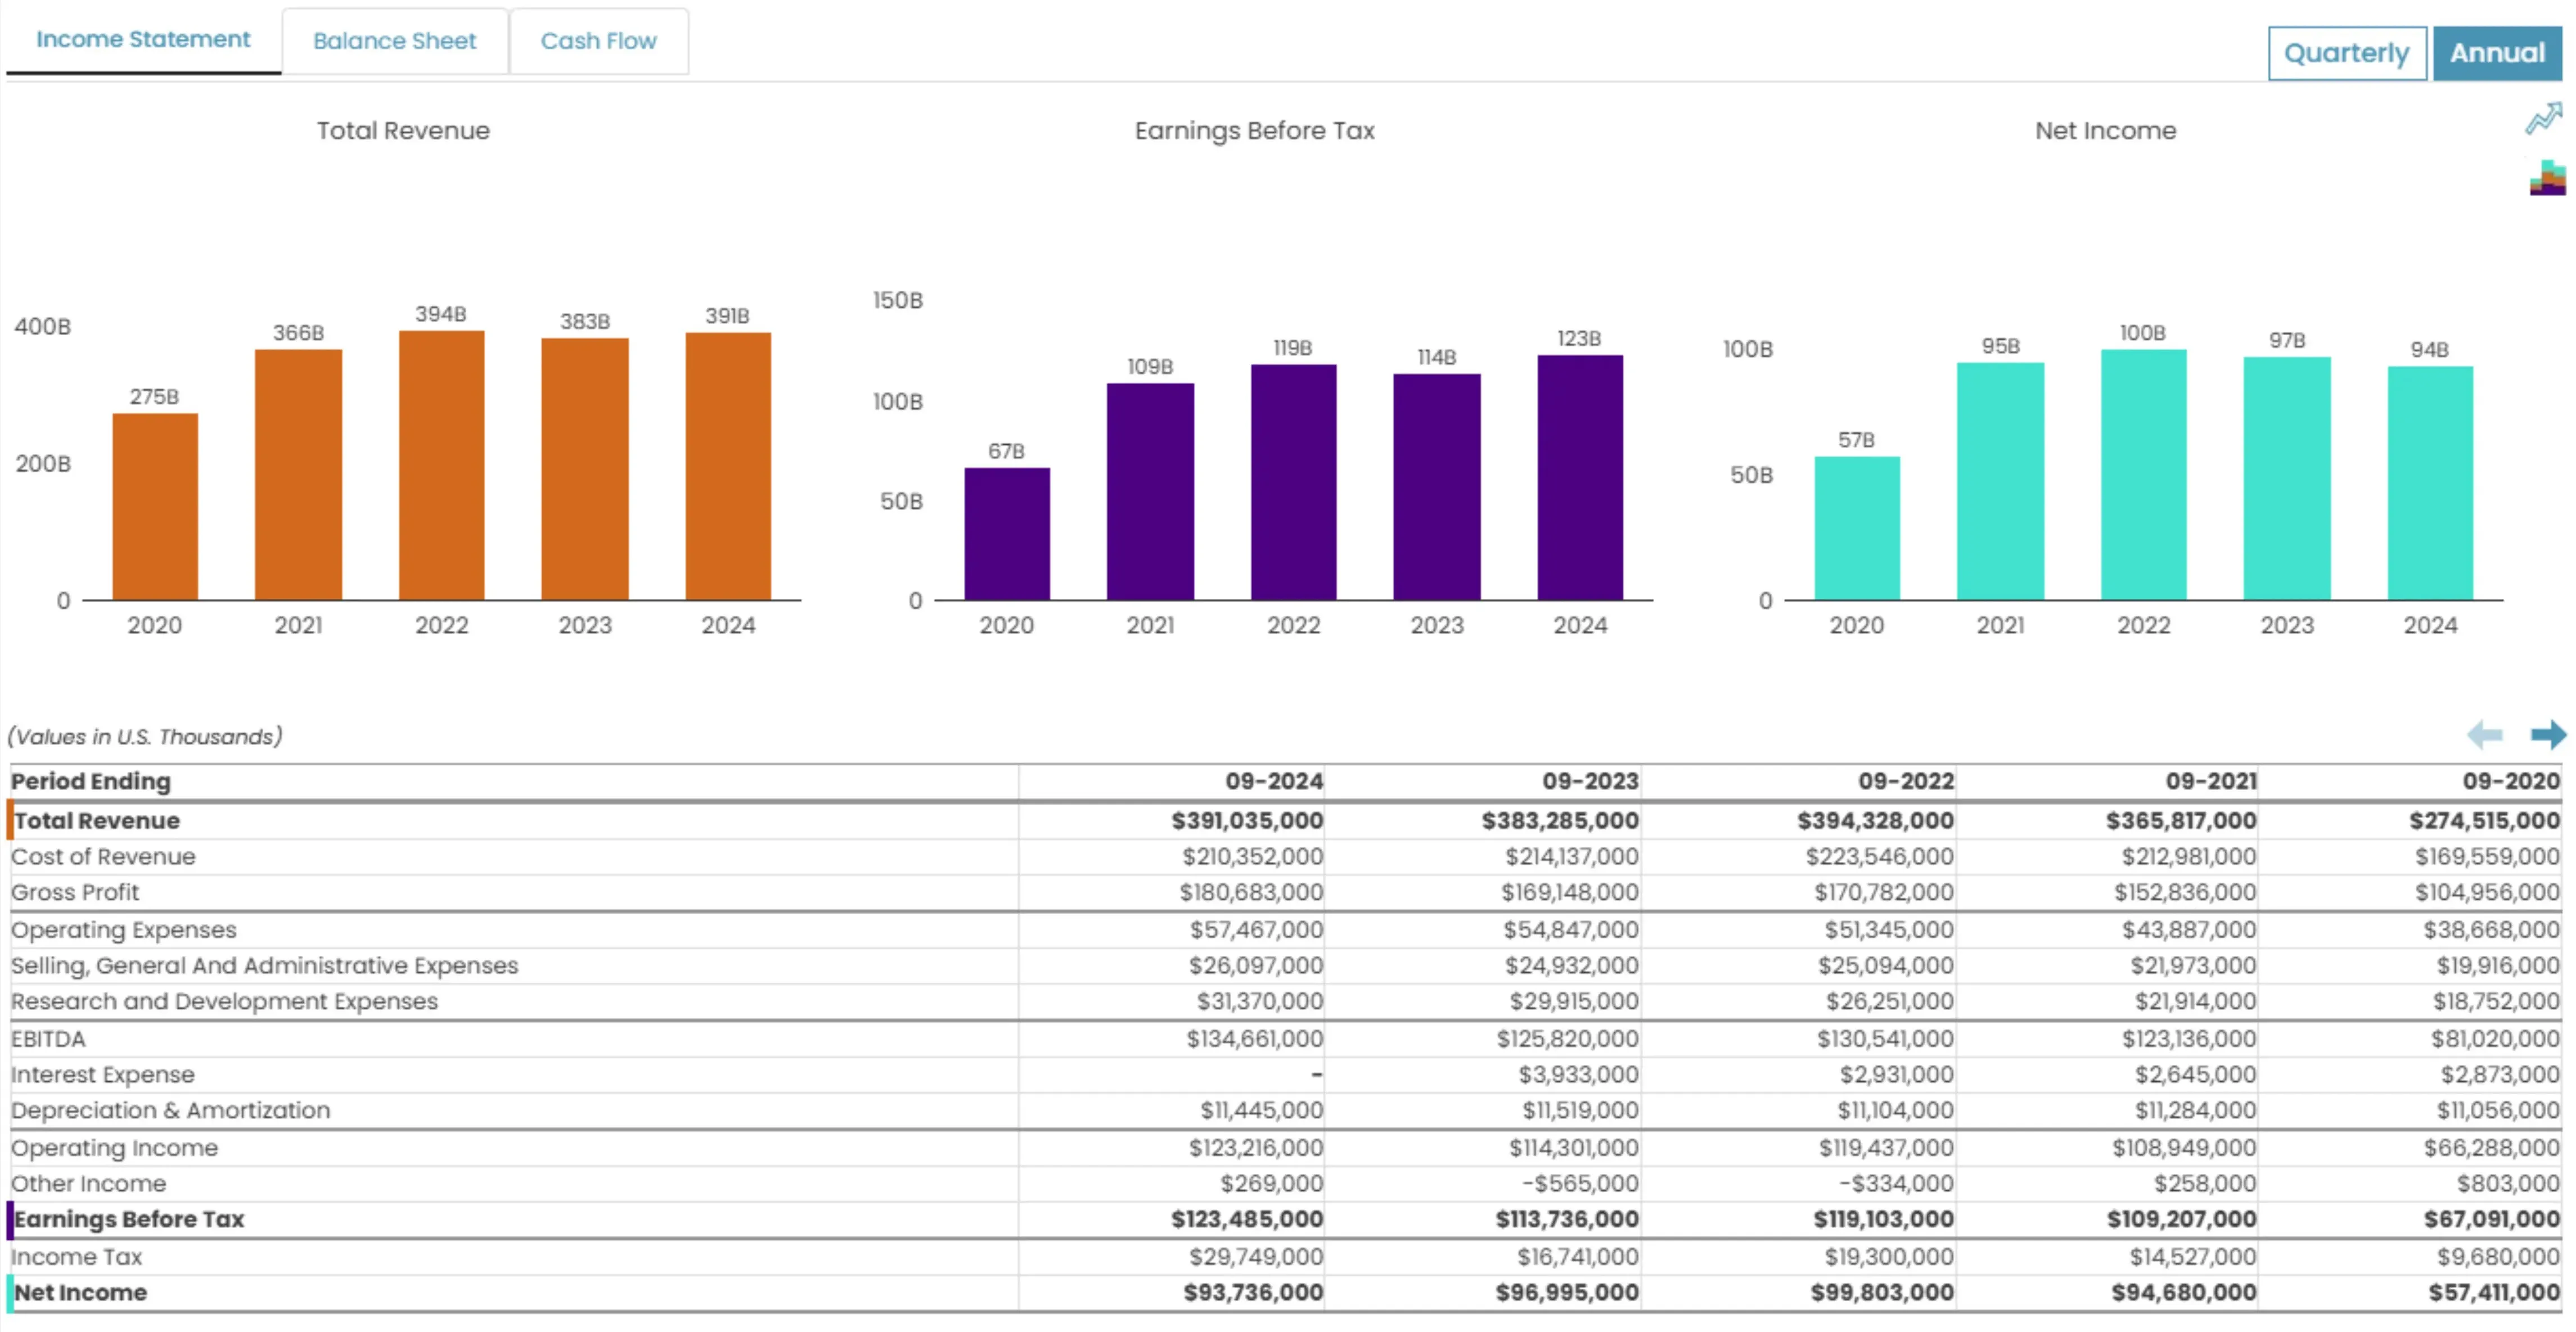
Financial Statements
Access quarterly and annual Income Statements, Balance Sheets & Cash Flow reports
Price Targets & Analyst Ratings
Consensus forecasts, Buy/Sell ratings and Upgrade/Downgrade trends
Portfolio
Portfolio Tracker
Get a complete view of all your investments in one place
Watchlist
My Watchlist
Track performance of your favorite assets & get smart alerts
Data & Insights
Charts
Track short-term / long-term trends with comprehensive charting
Sector Analysis
Visualize performance trends by Sector & Industry
Market Movers
Discover top gainers/losers and stocks making headlines with new highs & lows
Market Pulse
Dynamic visual dashboards (Heat Map, Bubble Chart, Tree Map)
News & AI
Sentiment Analysis
Stay Informed with Market and stock-specific news enhanced with intelligent sentiment scoring
Technical & Fundamental Analysis
Technical Indicators
Analyze stock trends with MACD, RSI, Moving Averages, Bollinger Bands & more
Fundamental Ratios
Evaluate company health with P/E, P/B, ROE, Debt/Equity and key valuation metrics
Interactive Stock Charts
Get Line, Candlestick, OHLC views — complete with overlays and advanced drawing tools
-
Use Cases
🌱 Core Investing
Stock Valuation
See P/E, P/B, debt ratios & analyst price targets at a glance — know instantly if a stock is cheap or expensive
Fundamental Ratios Analyst Price Targets Consensus SnapshotCompany Research
Explore any company's Income Statement, Balance Sheet & Cash Flow — annual or quarterly, with visual charts
Financial Statements Interactive Visuals Market News StreamFind Dividend Stocks
Screen for dividend payers by yield, payout ratio & history — never miss an ex-dividend date again
Stock Screener Dividend Calendar Fundamental FiltersBuild Your First Portfolio
Screen stocks, add to watchlist, track P&L and benchmark your holdings — all the tools a new investor needs
Portfolio Tracker Watchlist Preset Screens📊 Active Investing
Earnings Season Playbook
Track EPS estimates vs actuals, analyst upgrades/downgrades & buy/sell/hold consensus — before & after results
Earnings Calendar Analyst Recommendations Upgrades & DowngradesSector & Market Analysis
Monitor all 11 S&P sectors in real time, spot rotation trends & identify market movers making new highs/lows
Sector Groups Market Movers & Signals Market PulsePortfolio Management
Consolidated P&L, XIRR performance, sector exposure & benchmark comparison — across up to 10 portfolios
Portfolio Tracker Performance Analytics Benchmarking & XIRRETF & Fund Research
Compare ETFs and mutual funds side by side — expense ratios, sector exposure, performance & holdings
Mutual Funds & ETFs Sector Exposure Benchmark Comparison⚡ Precision Investing
Technical Analysis
Bollinger Bands, DEMA, SAR, SMA & RSI on multi-overlay interactive charts — time your entries & exits with precision
Multi-Overlay Charts Technical Indicators Multi-Chart LayoutsAdvanced Screening
Layer fundamental, technical & price-based filters together — screen across custom tickers or saved watchlists
Technical Filters Fundamental Filters Targeted ScreeningAI Sentiment Edge
ML-scored news sentiment overlaid on intraday price charts — see exactly when news moved the stock & by how much
ML Sentiment Scoring Sentiment Visualization Asset-Level NewsPeer & Competitive Analysis
Compare any stock vs its peers on P/E, PEG, Net Margin, D/E & 100+ custom metrics — side-by-side visual charts
Peer Comparison Custom Metric Layouts Interactive Visuals -
Resources
Tools
Calendars
Don't miss dividends, earnings, IPOs & stock splits — all on one market events tracker
Calculators
Compute compound interest, dividend yield, position sizing & investment returns instantly
Guide to Investing
Growth vs Value Investing
Two strategies, one decision — which approach fits your goals, or how to combine both
How to Read a Balance Sheet
Decode assets, liabilities & equity in plain English — no accounting degree needed
How to Use a Stock Screener
Filter 8,000+ stocks down to your best opportunities in seconds
Build Your First Portfolio Start Here
Step-by-step guide to diversification, stock selection & tracking performance
How to Value a Stock
Understand P/E, P/B & key ratios to judge if a stock is cheap or expensive
Dividend Investing Popular
Find stocks that pay you regularly — yields, ex-dates & payout ratios explained
Understanding Earnings Reports
What EPS means, how to track estimates & why it moves stock prices
Technical vs Fundamental Analysis
Which investing approach suits your goals — or learn how to combine both
- Pricing