SECTOR
PERFORMANCE
The Sector performance charts show the health of a group of companies in the same market segment. They show how a particular sector performs relative to the entire market and help in making an informed decision.

Filter by price performance, growth, fundamentals, valuation, dividends & technicals
Compare by expense ratios, sectors, performance
Access quarterly and annual Income Statements, Balance Sheets & Cash Flow reports
Consensus forecasts, Buy/Sell ratings and Upgrade/Downgrade trends
Get a complete view of all your investments in one place
Track performance of your favorite assets & get smart alerts
Track short-term / long-term trends with comprehensive charting
Visualize performance trends by Sector & Industry
Discover top gainers/losers and stocks making headlines with new highs & lows
Dynamic visual dashboards (Heat Map, Bubble Chart, Tree Map)
Stay Informed with Market and stock-specific news enhanced with intelligent sentiment scoring
Analyze stock trends with MACD, RSI, Moving Averages, Bollinger Bands & more
Evaluate company health with P/E, P/B, ROE, Debt/Equity and key valuation metrics
Get Line, Candlestick, OHLC views — complete with overlays and advanced drawing tools
See P/E, P/B, debt ratios & analyst price targets at a glance — know instantly if a stock is cheap or expensive
Explore any company's Income Statement, Balance Sheet & Cash Flow — annual or quarterly, with visual charts
Screen for dividend payers by yield, payout ratio & history — never miss an ex-dividend date again
Screen stocks, add to watchlist, track P&L and benchmark your holdings — all the tools a new investor needs
Track EPS estimates vs actuals, analyst upgrades/downgrades & buy/sell/hold consensus — before & after results
Monitor all 11 S&P sectors in real time, spot rotation trends & identify market movers making new highs/lows
Consolidated P&L, XIRR performance, sector exposure & benchmark comparison — across up to 10 portfolios
Compare ETFs and mutual funds side by side — expense ratios, sector exposure, performance & holdings
Bollinger Bands, DEMA, SAR, SMA & RSI on multi-overlay interactive charts — time your entries & exits with precision
Layer fundamental, technical & price-based filters together — screen across custom tickers or saved watchlists
ML-scored news sentiment overlaid on intraday price charts — see exactly when news moved the stock & by how much
Compare any stock vs its peers on P/E, PEG, Net Margin, D/E & 100+ custom metrics — side-by-side visual charts
Don't miss dividends, earnings, IPOs & stock splits — all on one market events tracker
Compute compound interest, dividend yield, position sizing & investment returns instantly
Two strategies, one decision — which approach fits your goals, or how to combine both
Decode assets, liabilities & equity in plain English — no accounting degree needed
Filter 8,000+ stocks down to your best opportunities in seconds
Step-by-step guide to diversification, stock selection & tracking performance
Understand P/E, P/B & key ratios to judge if a stock is cheap or expensive
Find stocks that pay you regularly — yields, ex-dates & payout ratios explained
What EPS means, how to track estimates & why it moves stock prices
Which investing approach suits your goals — or learn how to combine both
Visualize performance trends by Sector and Industry with dynamic visual
dashboards
like Sector performance chart, Heat maps, Bubble charts & Tree maps
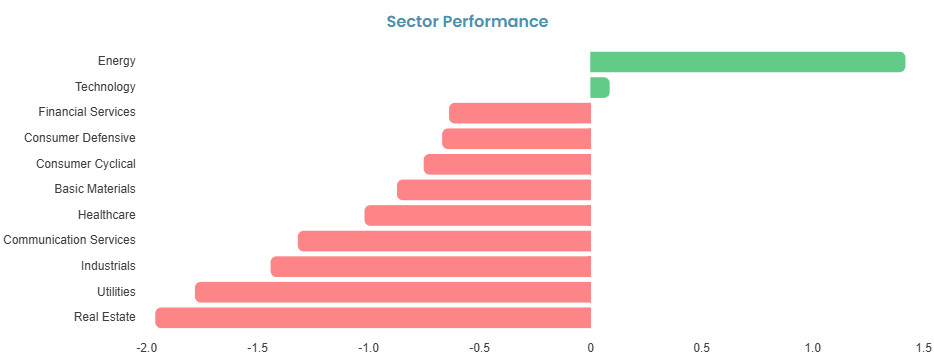
The Sector performance charts show the health of a group of companies in the same market segment. They show how a particular sector performs relative to the entire market and help in making an informed decision.
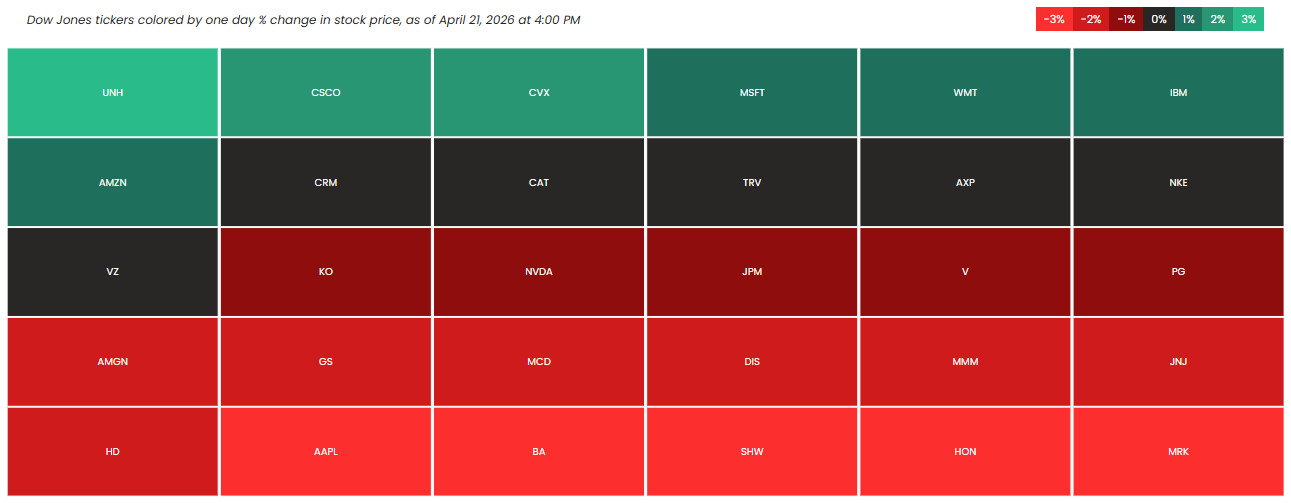
Live Heat maps provide tracking of best performance stocks. They help visualize how stocks are changing minute by minute giving an up to date market trend.
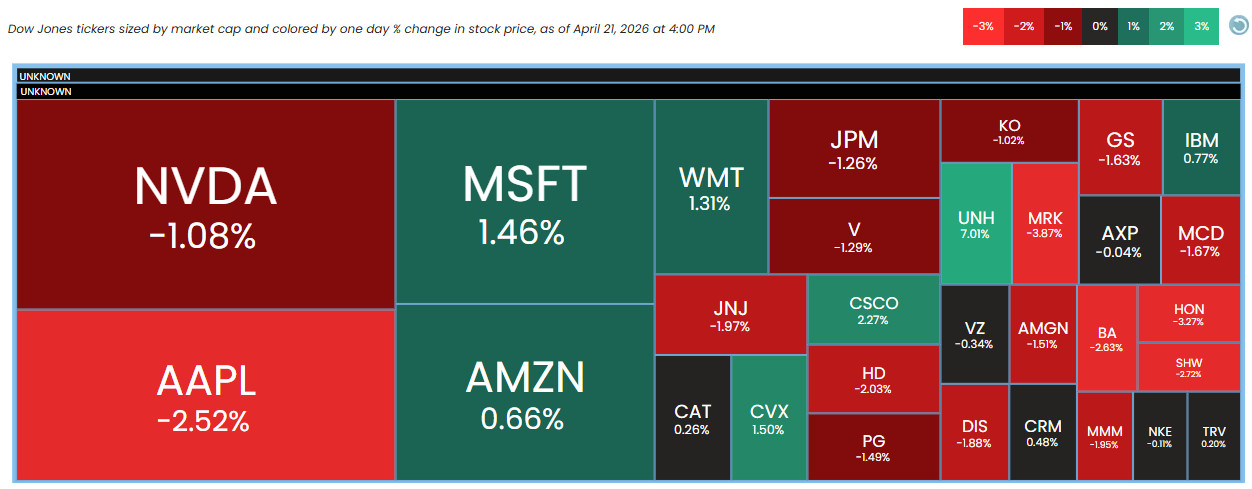
A powerful data visualization tool to identify top performance stocks at a glance. Tree maps use colored, sized rectangles to display stocks which make it easy to visualize key metrics like market cap, performance and trends across many stocks.

The Only Stock Research Platform You Need.
Data provided by Financial Modeling Prep
Quotes sourced from Nasdaq markets may
be delayed by up to 15 minutes.